THREATGET, is an Enterprise architect plugin developed by AIT, which allows to model and visualize a security-focused representation of a system. It enables the integration of “security-by-design” for security critical infrastructures during the whole system lifecycle (i.e., Design, Development and, Maintenance). By specifying a digital twin of the real-world system in the form of an extended data-flow diagram, automated – rule-based threat analysis is conducted, and security threats can be detected at any stage of the system lifecycle.
An example is given in Figure 1 a data-flow diagram is depicted in order to describe the internal interaction of multiple components within a vehicle boundary. Additionally, the figure depicts interaction with an external interaction, which demonstrates how data flow from an external terminal interacts with the vehicle’s environment.
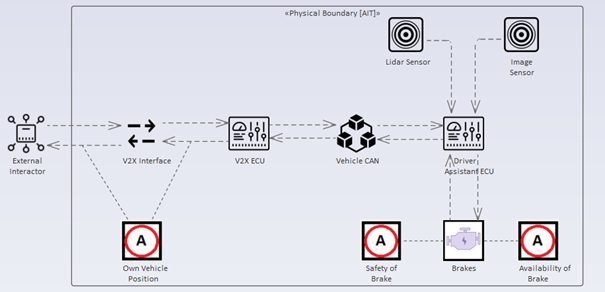
Figure 1: An exemplary model of a vehicle.
An External Interactor communicates with our car via the V2X Interface. The V2X ECU processes data and then transmits it to the Driver Assistant ECU through the Vehicle CAN. Additional data is received from a Lidar and an Image Sensor by the Driver Assistant ECU to control the brakes. The term “assets” refers to something valuable that must be protected, such as the integrity of the vehicle’s location, safety of brakes, and availability of brakes, which might be compromised and lead to negative consequences. The “A” letter in the model refers to assets, which represent something that needs more security concern, such as confidentiality of the vehicle’s position or the safety integrity of brakes. Each element used in the modelling process has specific security properties that can be configured based on the current state of the system.
Once the modelling process has been completed, the next step is to determine how secure the model is and whether any security gaps require additional security concerns. The following animation in Figure 2 shows how to trigger this process.
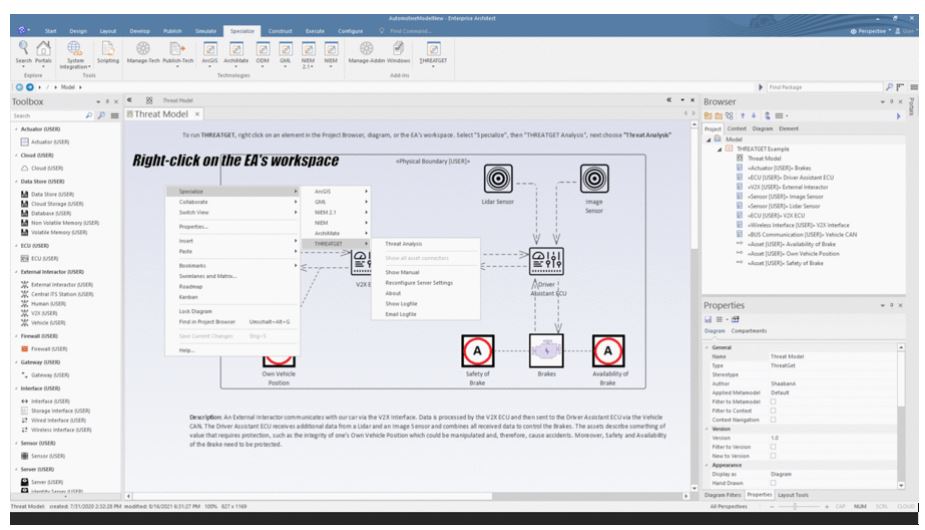
Figure 2: Running the threat analysis.
This initiates the threat analysis process. It then generates new packages based on the folder structure of the System Model as well as one diagram per package. This is to distinguish the detected threats by STRIDE category. Moreover, Risk Diagrams linking the threats with the affected elements, assets, and connections are generated. The result is shown in Figure 3. Additionally, a table containing the resulting threats is generated.
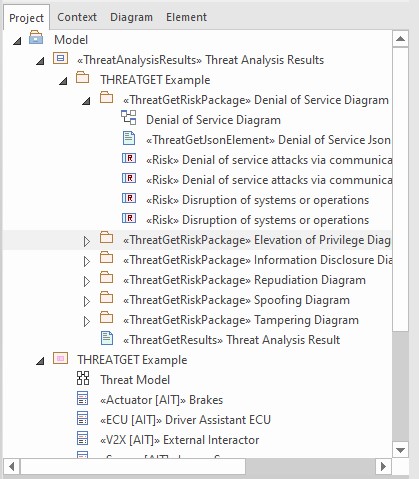
Figure 3: Generated risk diagrams.
THREATGET creates an interface that contains all identified potential threats and gives more information about each threat, such as its impact, likelihood, and severity level. Depending on previously defined security properties, the result may change. In addition, for each threat, the interface presents a graphical representation of all affected elements to highlight the influence of a threat on the model’s elements. This is illustrated in the animation in Figure 4.
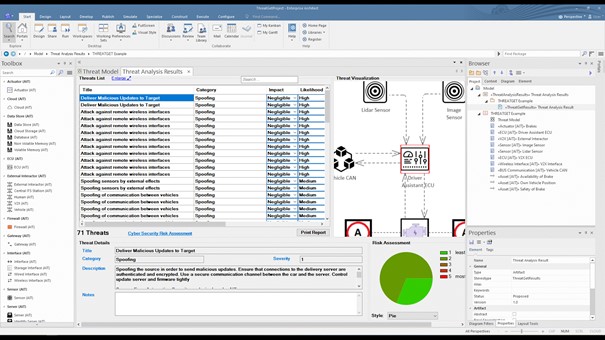
Figure 4: Threat analysis result.
The identified threats are listed in a table to reveal Impact and Likelihood values alongside name, description, and type of the threat. A diagram illustrates the currently selected threat based on the original data-flow diagram on the right side. The flow that a certain threat has throughout the system is marked in red, describing the affected elements, connectors, and assets. For example, if several elements are involved in a threat, they are all in the diagram. All related details for each identified threat can be viewed at the bottom section represented as Threat Details.
Threat Categories
Each Threat is categorized based on the STRIDE model:
S – Spoofing of user identity
T – Tampering
R – Repudiation
I – Information Disclosure
D – Denial of Service
E – Elevation of Privilege
Risk Matrix
Additionally, each threat is annotated with two extra parameters: Impact and Likelihood. These parameters are used to determine the threat’s risk severity level. Then, the overall risk level is estimated based on the previous calculation of each threat’s severity individually. An exemplary risk matrix is shown in Figure 5.
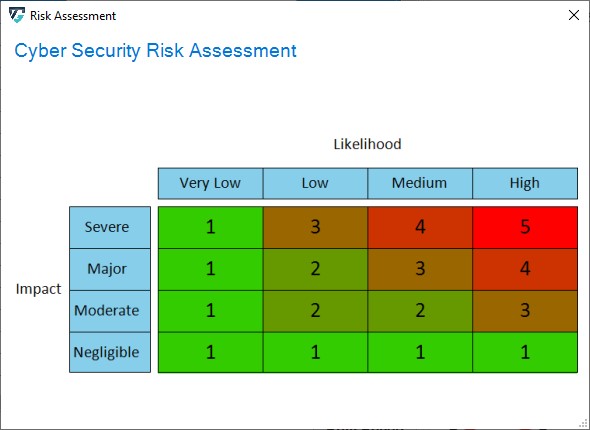
Figure 5: An exemplary risk matrix.
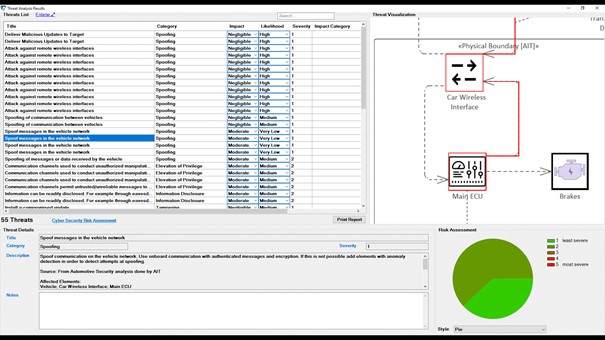
Furthermore, users can adjust these values for any threats listed in the UI by selecting newly adapted values from drop-down menus. The change immediately affects the severity level, as displayed in the animation in Figure 6.
Figure 6: Adjustment of severities.
THREATGET enables the development of a secure system by planning and integrating security measures during the whole system lifecycle.

Sebastian Chlup received his master’s degree in computer science in 2020 at the University of Vienna. He has been working for the AIT Austrian Institute of Technology GmbH for more than 5 years in the department of Safety and Security. His main activities include cybersecurity engineering, software development for THREATGET and project management.

Abdelkader Magdy Shaaban, Dr., received his doctoral degree in computer science from the University of Vienna in 2021. Currently, he is a scientist in the Center for Digital Safety & Security – AIT Austrian Institute of Technology. His research interests are in cybersecurity engineering, mainly in IoT and the automotive domain. He focuses on threat analysis and security requirements management processes driven by security standardizations (e.g., ISA/IEC 62443-series, ISO 21434, IEEE 1686, and ISO/IEC 27000-series).
